
#CarbonMarkets #VCM #REDD #ARR #MRV #FirstMileData #NBS
The Berkeley Carbon Trading Project has released version 2026-06 of its Voluntary Registry Offsets Database, with data through 30 June 2026. The database compiles project and credit records from six registries — ACR, ART, CAR, Gold Standard, ISO and Verra — into a single filterable dataset, and is published free at gspp.berkeley.edu. The build we analysed carries 11,468 project records.
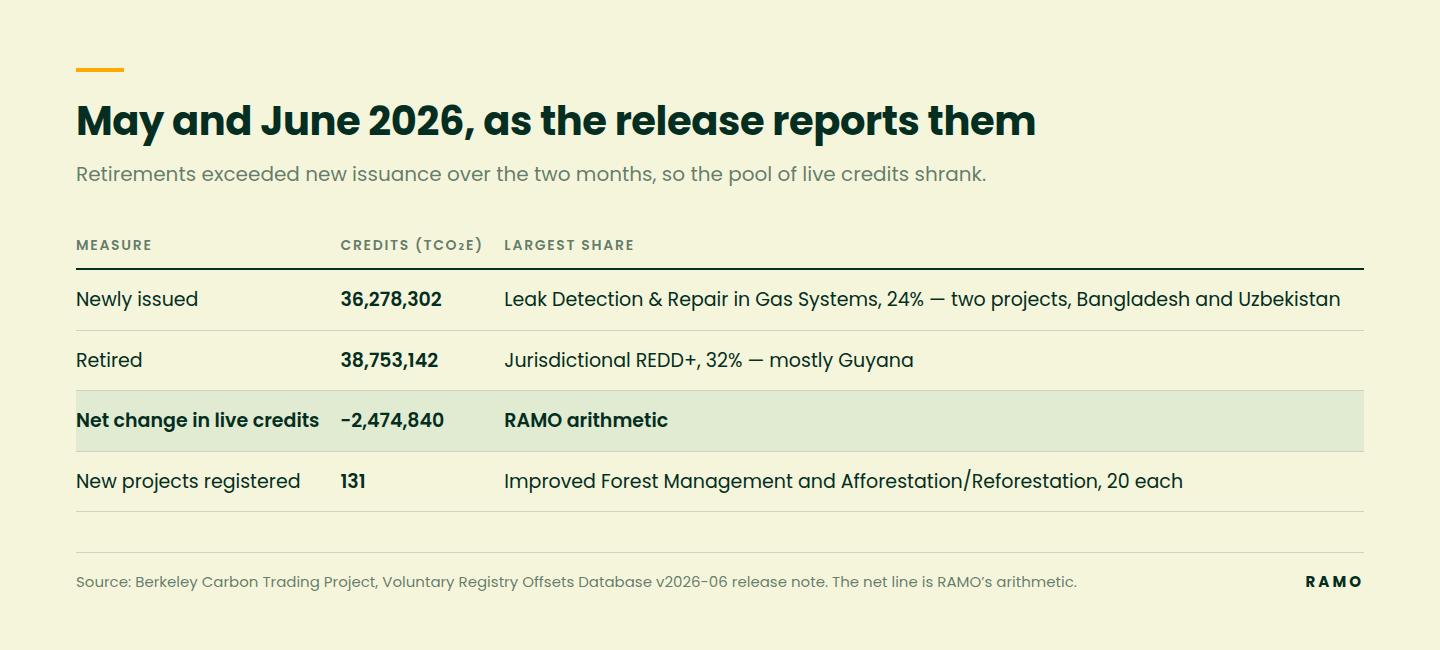
The release note reports two months of activity: 131 new projects, 36,278,302 credits newly issued and 38,753,142 credits retired. It is a short note about a large object, and the two-month flow is the least interesting thing in it. The database also describes the stock — every project ever registered on those six registries, including the ones that never produced anything.
That stock contains a number that anyone financing a land-use project should know. Of the 2,548 forestry and land-use projects in the database, 1,598 have never issued a single credit. What follows sets out the two months as announced, then the stock behind them, then where the attrition sits.
Berkeley reports 131 new projects for May and June 2026. The most common types were Improved Forest Management and Afforestation/Reforestation, with 20 new projects each — 40 of the 131, on our count, are forestry.
Issuance and retirement went to different places. The largest share of the 36,278,302 newly issued credits went to Leak Detection & Repair in Gas Systems, 24 percent of the total from two projects in Bangladesh and Uzbekistan, followed by cookstoves at 15 percent. The largest share of the 38,753,142 retirements was Jurisdictional REDD+ at 32 percent, mostly Guyana, followed by cookstoves at 16 percent.
Two things follow from those figures that the note does not draw out. Retirements exceeded new issuance over the two months by 2,474,840 credits, so the pool of live credits shrank. And the activity types receiving the credits are not the activity types being registered: forestry accounted for roughly three in ten new projects and none of the four largest issuance or retirement categories.
Across the whole database, 2,654,958,149 credits have been issued and 1,561,901,935 retired — 58.8 percent of everything ever issued — leaving 1,093,056,214 credits outstanding. Two months of issuance is 1.37 percent of the all-time total.
The distribution of that issuance is narrow. On our analysis of the 11,468 records, the largest 1 percent of projects account for 41.2 percent of every credit ever issued, and the largest 10 percent account for 82.0 percent. A market of eleven thousand projects behaves, in volume terms, like a market of about a thousand.
The corollary is the more useful figure. 5,452 of the 11,468 projects — 47.5 percent — have never issued a credit. They are registered, listed, in development, withdrawn or dormant, and they have produced nothing. Registration and issuance are different events, and the gap between them is where most project effort ends.
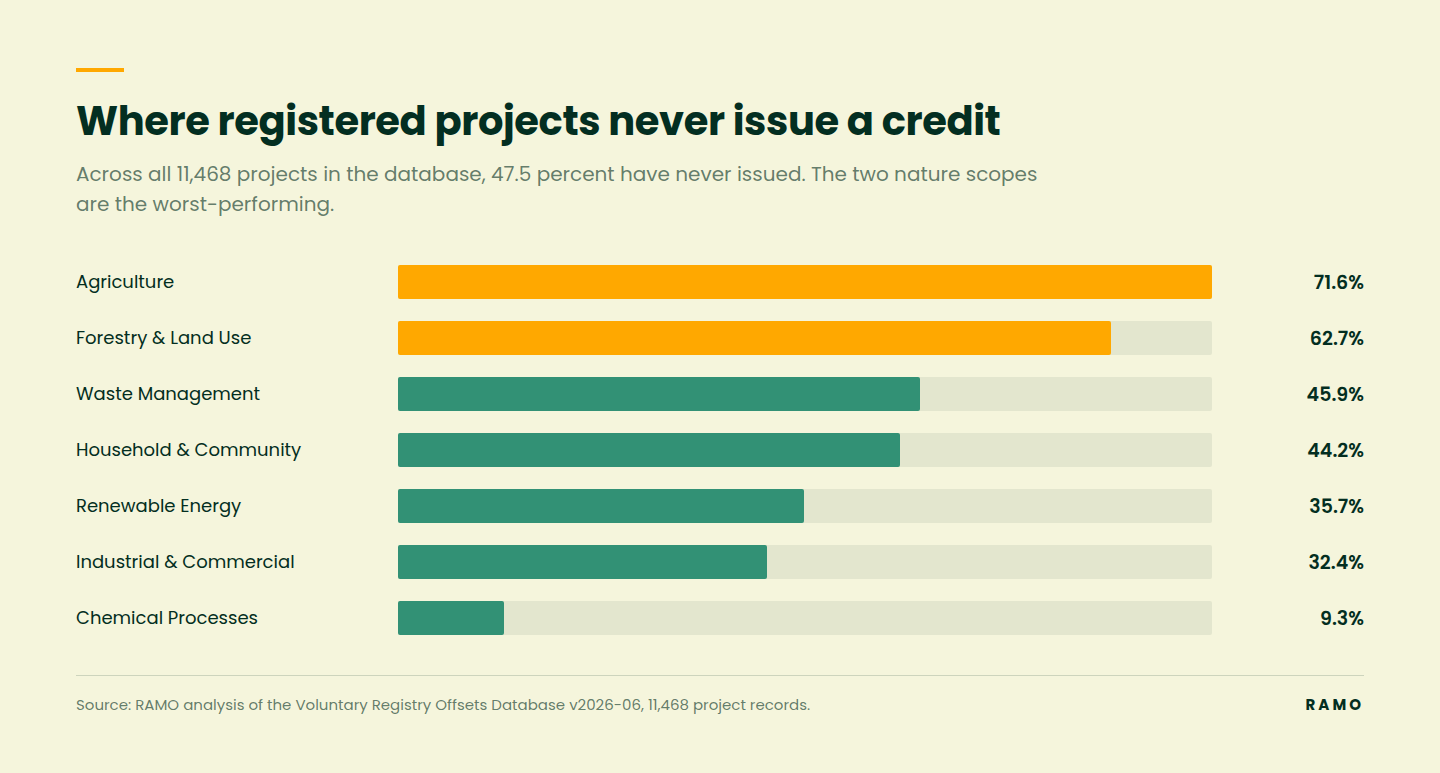
The never-issued rate is not evenly distributed. Chemical Processes projects issue almost always — 9.3 percent have never issued. Renewable Energy sits at 35.7 percent, close to the market average. Forestry and Land Use is at 62.7 percent and Agriculture at 71.6 percent. Taken together, the two nature scopes are 3,805 projects, of which 2,498 have never issued.
Within land use the spread is wider still. Improved Forest Management, the most numerous land-use type at 1,140 projects, has the best record at 45.5 percent never issued. Afforestation and reforestation — 773 projects, and one of the two most-registered types in the current release — sits at 79.6 percent. Wetland restoration is at 89.7 percent and sustainable grassland management at 90.8 percent.
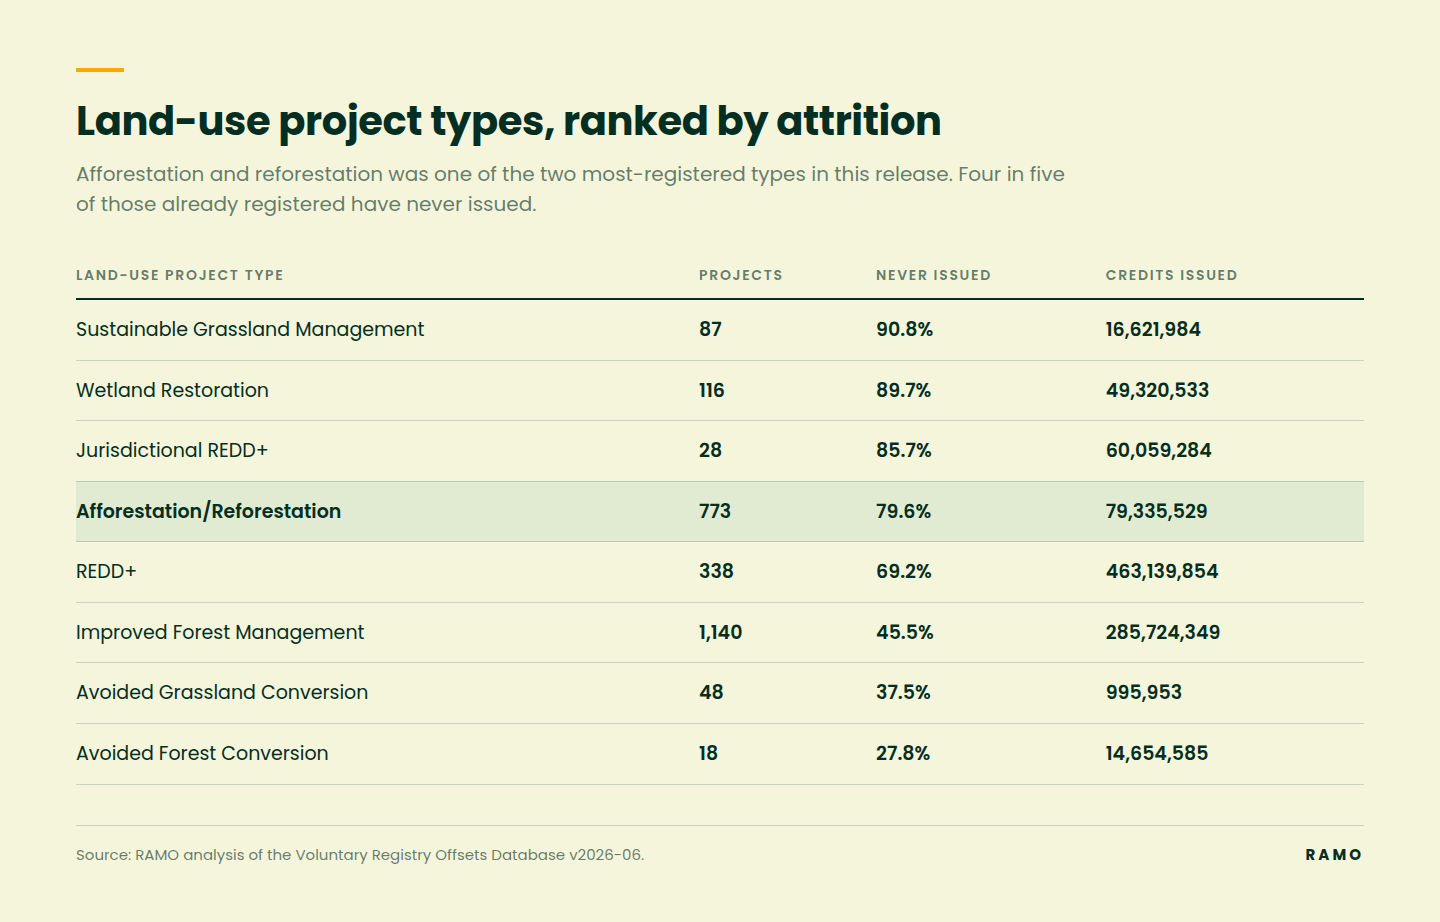
These are not small categories being distorted by small numbers. Afforestation and reforestation has 773 registered projects and 158 that have ever issued a credit. On the current base rate, of the 20 new afforestation and reforestation projects registered in May and June, four would be expected to issue.
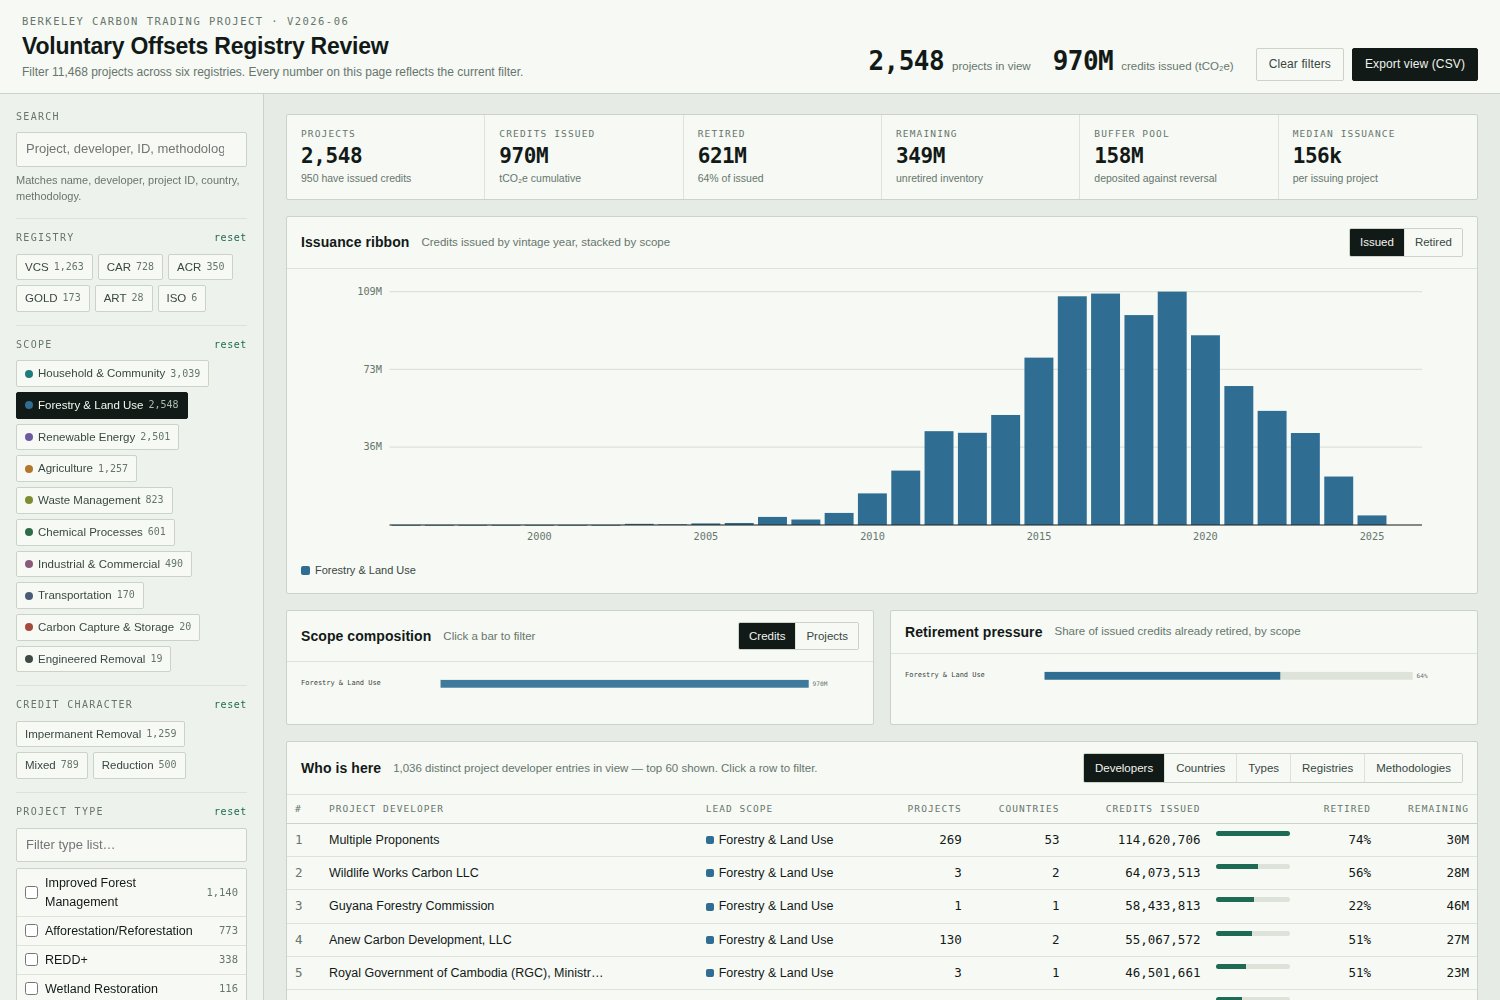
Nor is the issue that land use produces few credits. Forestry and land use is 22.2 percent of projects and 36.5 percent of all credits ever issued — the largest single scope by volume. The category works. It works for a minority of the projects that enter it.
950 forestry and land-use projects have issued at least one credit. Among them the median issuance is 156,436 credits and the mean is 1,020,897 — a gap that tells you the average is being carried by a small number of very large projects. The ten largest land-use projects account for 34.3 percent of all land-use issuance. The largest single one has issued 58,433,813 credits.
For afforestation and reforestation the median among issuing projects is 132,968 credits. At any plausible price that is a modest revenue line against the cost of validation, verification and a decade of monitoring. The distribution matters for anyone modelling a land-use project from comparables: the mean is not the expected case, and the projects that set the mean are not comparable to most new entrants.
Two further characteristics distinguish the land-use stock. Its credits are retired faster than the market’s — 64.0 percent of land-use issuance has been retired against 58.8 percent overall. And it carries essentially all of the market’s permanence collateral: of 159,454,900 credits held in buffer pools across the database, 157,941,531 — 99.1 percent — are held against forestry and land-use projects, equal to 16.3 percent of everything that scope has issued.
The rest of this piece describes the data. This section is our reading of it.
A 62.7 percent never-issued rate in forestry and land use is not evidence that land-based carbon does not work. The same dataset shows the scope producing more credits than any other. It is evidence about where projects fail, and they fail early — between the idea and the first issuance, in the stretch where a developer is spending money on land tenure, consent, baseline measurement and validation, with no revenue and no instrument to finance against.
This is the same constraint from a third direction. Kenya’s carbon markets guide excluded land use from its Article 6 whitelist because rangeland baseline data were not credible enough for the state to underwrite an adjustment against; we read that in this piece. WRI and Google’s AI for Nature working paper concluded that the effectiveness of AI is bounded by primary data collected in the field; we read that here. And the enabling infrastructure that makes nature investable is scarcest where nature is least investable, which is what we took from Gaining Ground. Berkeley’s database is the outcome those three describe, counted.
What the data cannot tell you is which of the 5,452 never-issued projects were abandoned, which are still in a validation queue, and which were never viable. The database records status, not cause of death. That distinction would be worth having, and no public dataset currently supplies it.
What it can tell you is the base rate, and a base rate is the right starting point for diligence. Four in five registered afforestation and reforestation projects have not issued. A developer or investor presenting one should be able to say what makes theirs the fifth: which measurements exist, who took them, to what protocol, and whether a validator could re-perform them. In our experience that question is answered by field records — plots, allometry, tenure documents, consent evidence, a QA/QC trail — rather than by a model or a pipeline diagram.
That is what NatureOS is built to hold: the source documents, the field measurements, the remote sensing and the project record in one place, so that the evidence behind a claim can be traced rather than asserted. The buffer figure makes the point in the market’s own language — land use posts 99.1 percent of the collateral because it carries the permanence risk, and permanence risk is priced on the quality of the underlying measurement.
One closing observation on the database itself. It is the only public record that lets anyone compute the figures above, and it is maintained on grant funding — the current release credits the Mastercard Foundation Scholars Program at UC Berkeley for supporting its developer through the 2025–26 academic year, and the release note asks for support to keep it going. Market infrastructure that everyone cites and nobody funds is a familiar pattern, and it is the same pattern this piece is about.
We have built an interactive review tool over the full v2026-06 release: all 11,468 projects across six registries, filterable by registry, scope, credit character, project type, status, region, country, developer and methodology, with an issuance ribbon by vintage, scope composition, retirement pressure and a per-project detail view, and every view exportable to CSV. Every figure in this piece can be reproduced in it. Open the RAMO review tool for the offsets database.
To go further on this material — the base rates for a specific country or methodology, and what it would take to make a particular project’s baseline defensible — try NatureOS, RAMO’s operating system for nature-based projects. Explore NatureOS.
Berkeley Carbon Trading Project (2026). Voluntary Registry Offsets Database, version 2026-06, data through 30 June 2026. Goldman School of Public Policy, University of California, Berkeley (database).
Berkeley Carbon Trading Project (2026). Release note for v2026-06, Barbara Haya and Pamela Quartson. The figures for May and June 2026 — 131 new projects, 36,278,302 credits issued, 38,753,142 retired, and the shares by project type — are as stated in that note. The note records that the database’s developer was supported by the Mastercard Foundation Scholars Program at UC Berkeley during the 2025–26 academic year, and invites support to sustain the resource.
Berkeley Carbon Trading Project. Voluntary Registry Offsets Database Calculations and Change Log, which set out how the database’s fields are derived (calculations).
All project counts, issuance and retirement totals, never-issued rates, buffer figures and concentration measures in this piece are RAMO Earth Co.’s computations from the v2026-06 project records, unless attributed to the release note. They are not statements of the Berkeley Carbon Trading Project or of any registry. Credit counts are as reported by the registries to the database; the database records project status, not the reason a project has not issued.


